How to Email Pivot Tables in Google Sheets
Pivot tables in Google Spreadsheets provide a way to summarize data in your spreadsheet, automatically aggregating, sorting, counting, or averaging the data while displaying the summarized results in a new table.
Pivot tables are commonly used to:
- Narrow down a large data set.
- See relationships between data points.
Pivot tables present a processed view of the data and exist at a location in the spreadsheet that is different from the source data. You can add Pivot tables either in a new sheet or at a different place in the existing sheet.
Email Pivot Tables
With Email Spreadsheets, you can easily embed the pivot table in your emails and share it with your colleagues, clients or peers.
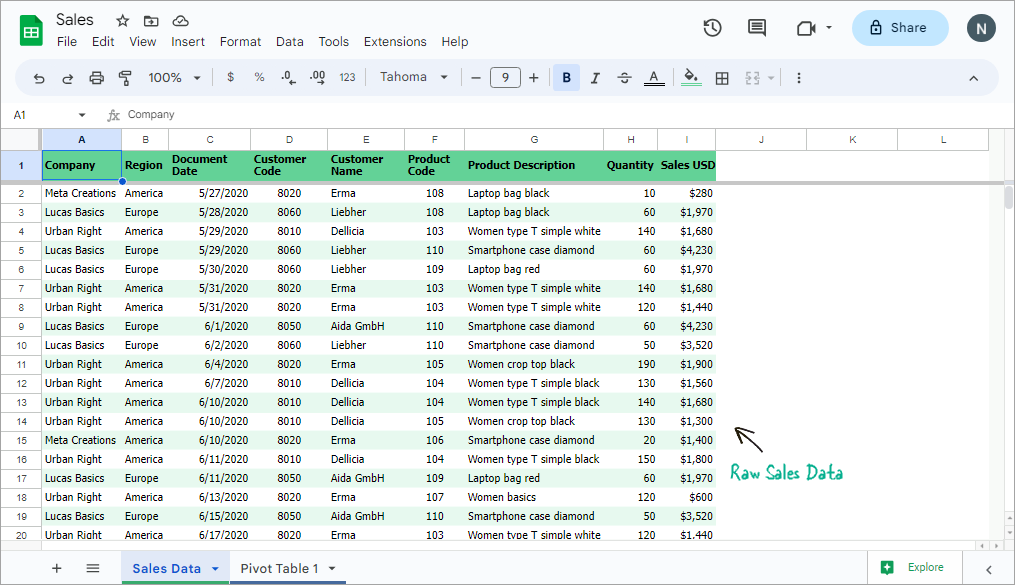
Raw Sales Data
Our sample Google Sheet contains the details of companies, their region, customer details, product details, quantity and amount of sales in USD.
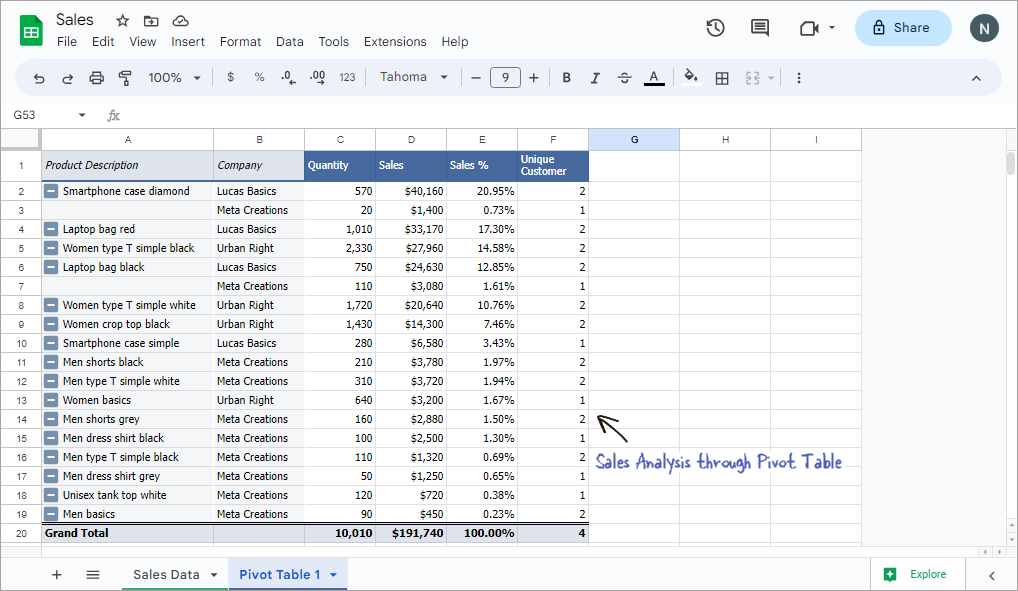
Pivot Table
We have cross-analyzed this data in a pivot table based on the Product description and the company, and calculated the Total Quantity, Sales, Sales % and Number of Unique Customers.
Embed Pivot Table in Email
To embed the pivot table in your emails using Email Spreadsheets, follow these steps:
- Launch the add-on in the current spreadsheet and create a workflow.
- (Optional) Select one or more sheets to be sent as an attachment and the corresponding export format. Give the export files a suitable name or continue with the default name.
- Switch to the email editor tab, and add the sender’s and recipients’ details. Specify the Email subject line by choosing pre-built markers from the list or typing a different subject.
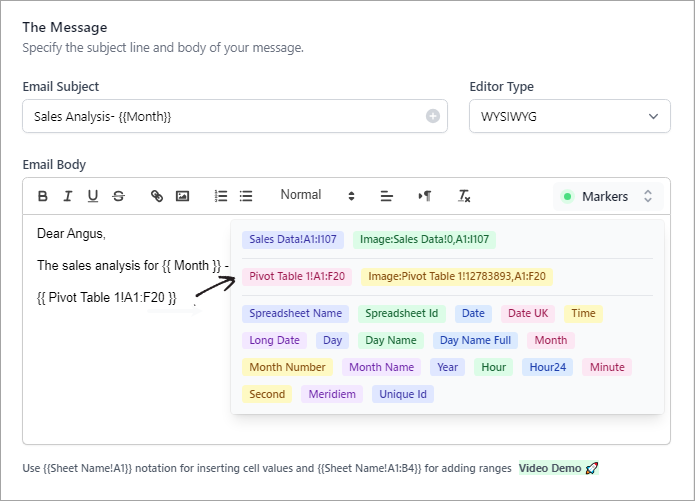
- In the Email body, click on the ‘Markers’ dropdown list containing all the tables and charts of the spreadsheet, including the pivot table.
- If the pivot table is in a separate sheet, there will be a marker to embed the table as it is.
- If the pivot table is in the same sheet as the source data, the marker for embedding the data will be the same as the sheet name. In this case, you will have to input the range of cells in that sheet where the pivot table is located.
- You can embed the pivot table in your message body either as an HTML table or a PNG image.
- The HTML table will preserve all the formatting and layout of the pivot table. The syntax is:
{{ Sheet Name!Range of cells }} - To embed the pivot table as an image, use the syntax
{{ Image:Sheet Name!Unique id,Range of cells }}- you can find this marker in the Markers dropdown.
When you are ready to test your workflow, click the Preview button to send a test email to your email address. This will give you a good idea of how the email will look in the recipient’s inbox.
Once the workflow is ready, you can click the Send button to immediately send the email to the specified recipients.
Alternatively, you can proceed to the Scheduler screen to define a schedule and automatically send the pivot table emails at a later date and time (like the 1st Monday of every month).