Charts in Google Sheets - Embed Charts in Emails
With Email Spreadsheets, you can embed dynamic charts and graphs from Google spreadsheets in your emails.
Say you are a part of the marketing team of your company and need to email performance analysis reports of various marketing campaigns to your manager fortnightly.
We have a Google Spreadsheet with data of your company’s daily impressions, number of customer acquisitions and cost per acquisition (CPA) generated by 3 marketing campaigns in the past 2 weeks. We have also prepared relevant charts to systematically represent and give an overview of the data.
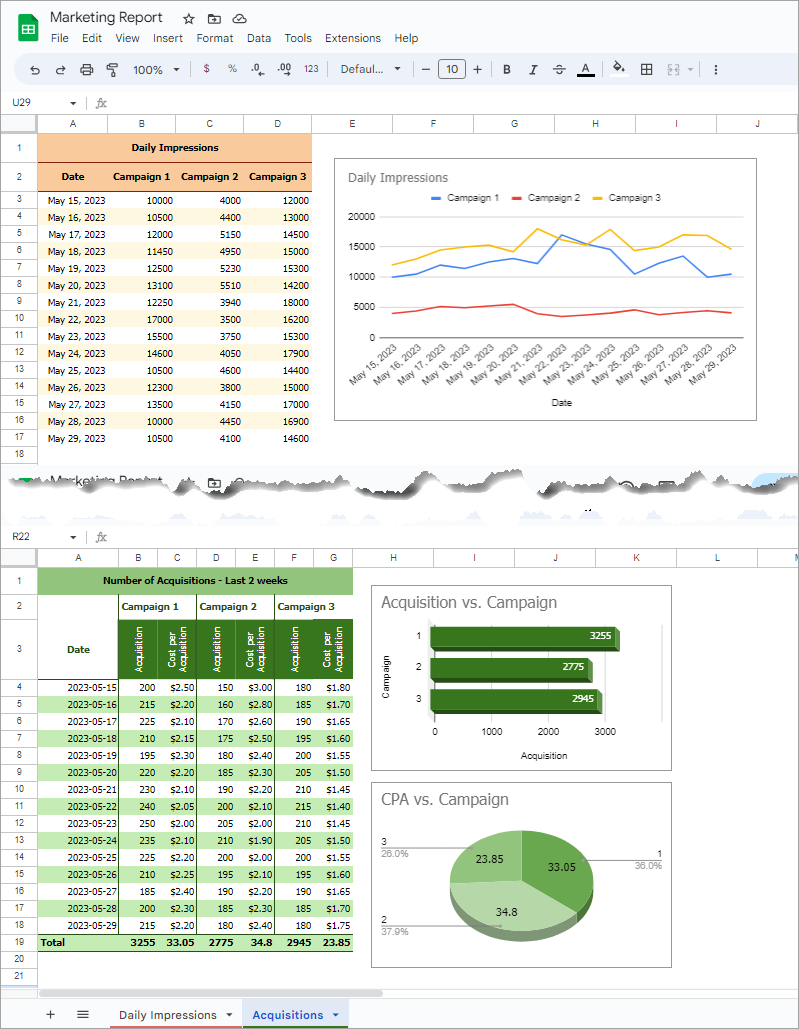
To share the marketing report, we do not need to email the entire data to the manager. You can directly embed the chart images, contained inside the Google Sheet, in your mail body with the help of Email Spreadsheets, and then schedule it accordingly.
To embed charts from Google Sheets in an email, launch the add-on inside the same Google Sheet that contains the charts. Create a new workflow.
Select the sheets you want to attach; and name the export file. Customize PDF settings if required and click continue. Now, in the Email Editor, add the sender’s and recipient's details, and enter the email subject line by choosing from the pre-built markers or typing it manually.
In the Email Body, click on ‘Markers’ to view a list of available markers for embedding data and charts in your message body. You will notice that all the charts that exist in your spreadsheet are also a part of this list of markers, and have the following syntax.
{{ Chart:Sheet Name!Chart Id }}
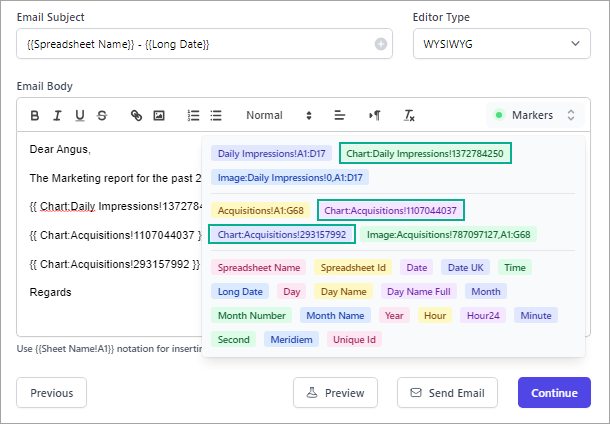
In our Google Spreadsheet, we have 3 separate charts, and we will embed all three of them in the email body by selecting the corresponding markers from the list.
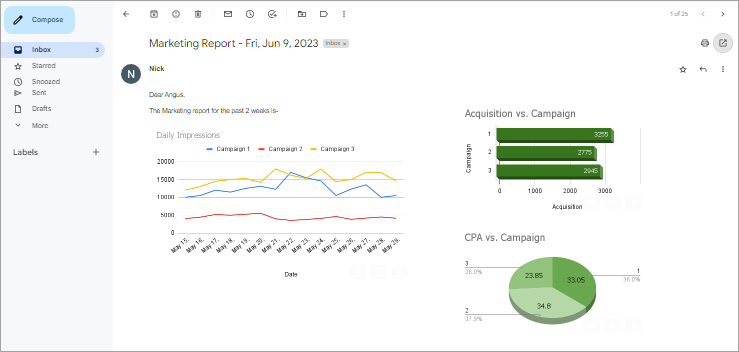
Click the ‘Preview Email’ button to send a test email to yourself. You will receive an email with the charts embedded in the email body.
Google sheets assign a unique id to all the charts you create so that it is easy for you to differentiate among them.