Embed Dynamic Charts and Graph Images in Documents and Emails
With Document Studio, you can embed dynamic chart images and graphs from Google Sheets in your emails and generated documents. The charts can be embedded inside presentations, documents and spreadsheet templates.
The Google Spreadsheet that contains the original chart image should either be owned by you or shared with your Google account.
Embed Chart Syntax
The default syntax for embedding chart images in documents and emails is:
{{ Embed CHART, Spreadsheet Id, sheet=SheetName, position=ChartPosition, width=Width, height=Height }}
- Spreadsheet Id - The ID of the Google Spreadsheet that contains the chart image
- SheetName - The name of the Google Sheet (workbook) inside the spreadsheet that contains the chart image
- ChartPosition - The position of the chart image in the sheet. The position is 1-based.
- Width - The width of the embedded chart image in pixels (default is 600).
- Height - The height of the embedded chart image in pixels (default is 600).
Embed Chart Example
We have a sample spreadsheet that tracks the prices of Cryptocurrencies using the built-in GOOGLEFINANCE function.
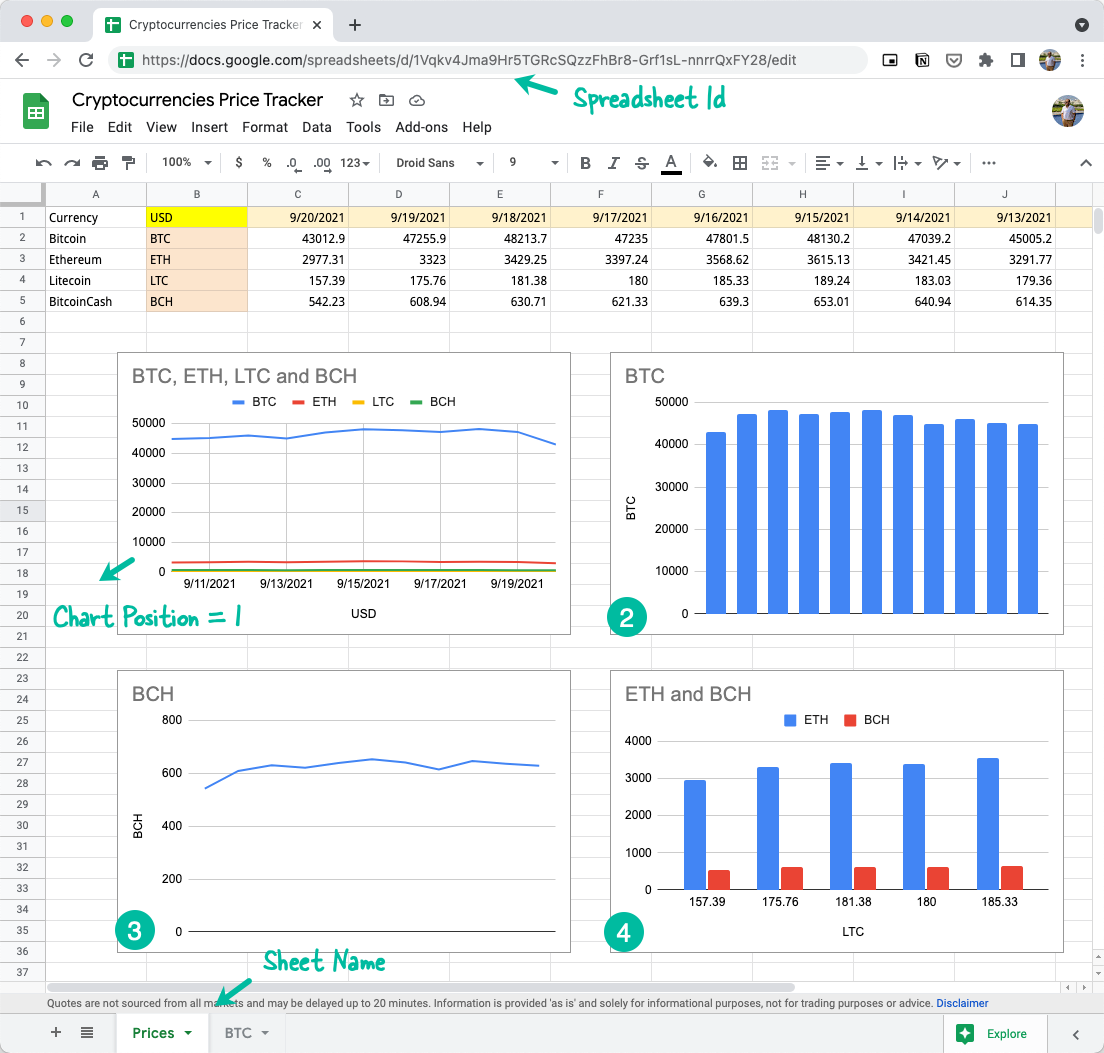
Spreadsheet Id
The Spreadsheet Id can be found in the Google Spreadsheet URL itself. For instance, if the spreadsheet URL is:
https://docs.google.com/spreadsheets/d/1Vqkv4Jma9Hr5TGRcSQzzFhBr8-Grf1sL-nnrrQxFY28/edit#gid=0
The Spreadsheet Id is the string between /d and /edit and, in this case, is 1Vqkv4Jma9Hr5TGRcSQzzFhBr8-Grf1sL-nnrrQxFY28.
Sheet Name
The spreadsheet has two worksheets, titled Prices and BTC, and each worksheet has one or more chart images.
Chart Position
The Prices sheet has four chart images, generated dynamically from the price table on the same sheet, and each chart has an internal position. The chart of the upper left has index as 1, the chart adjacent to it has index as 2, and so on.
Embed Charts and Graphs Formula
If you are to embed the second chart (BTC bar graph) in your document template or email, the embed syntax would be:
{{ Embed CHART, 1Vqkv4Jma9Hr5TGRcSQzzFhBr8-Grf1sL-nnrrQxFY28, sheet=Prices, position=2, width=200 }}
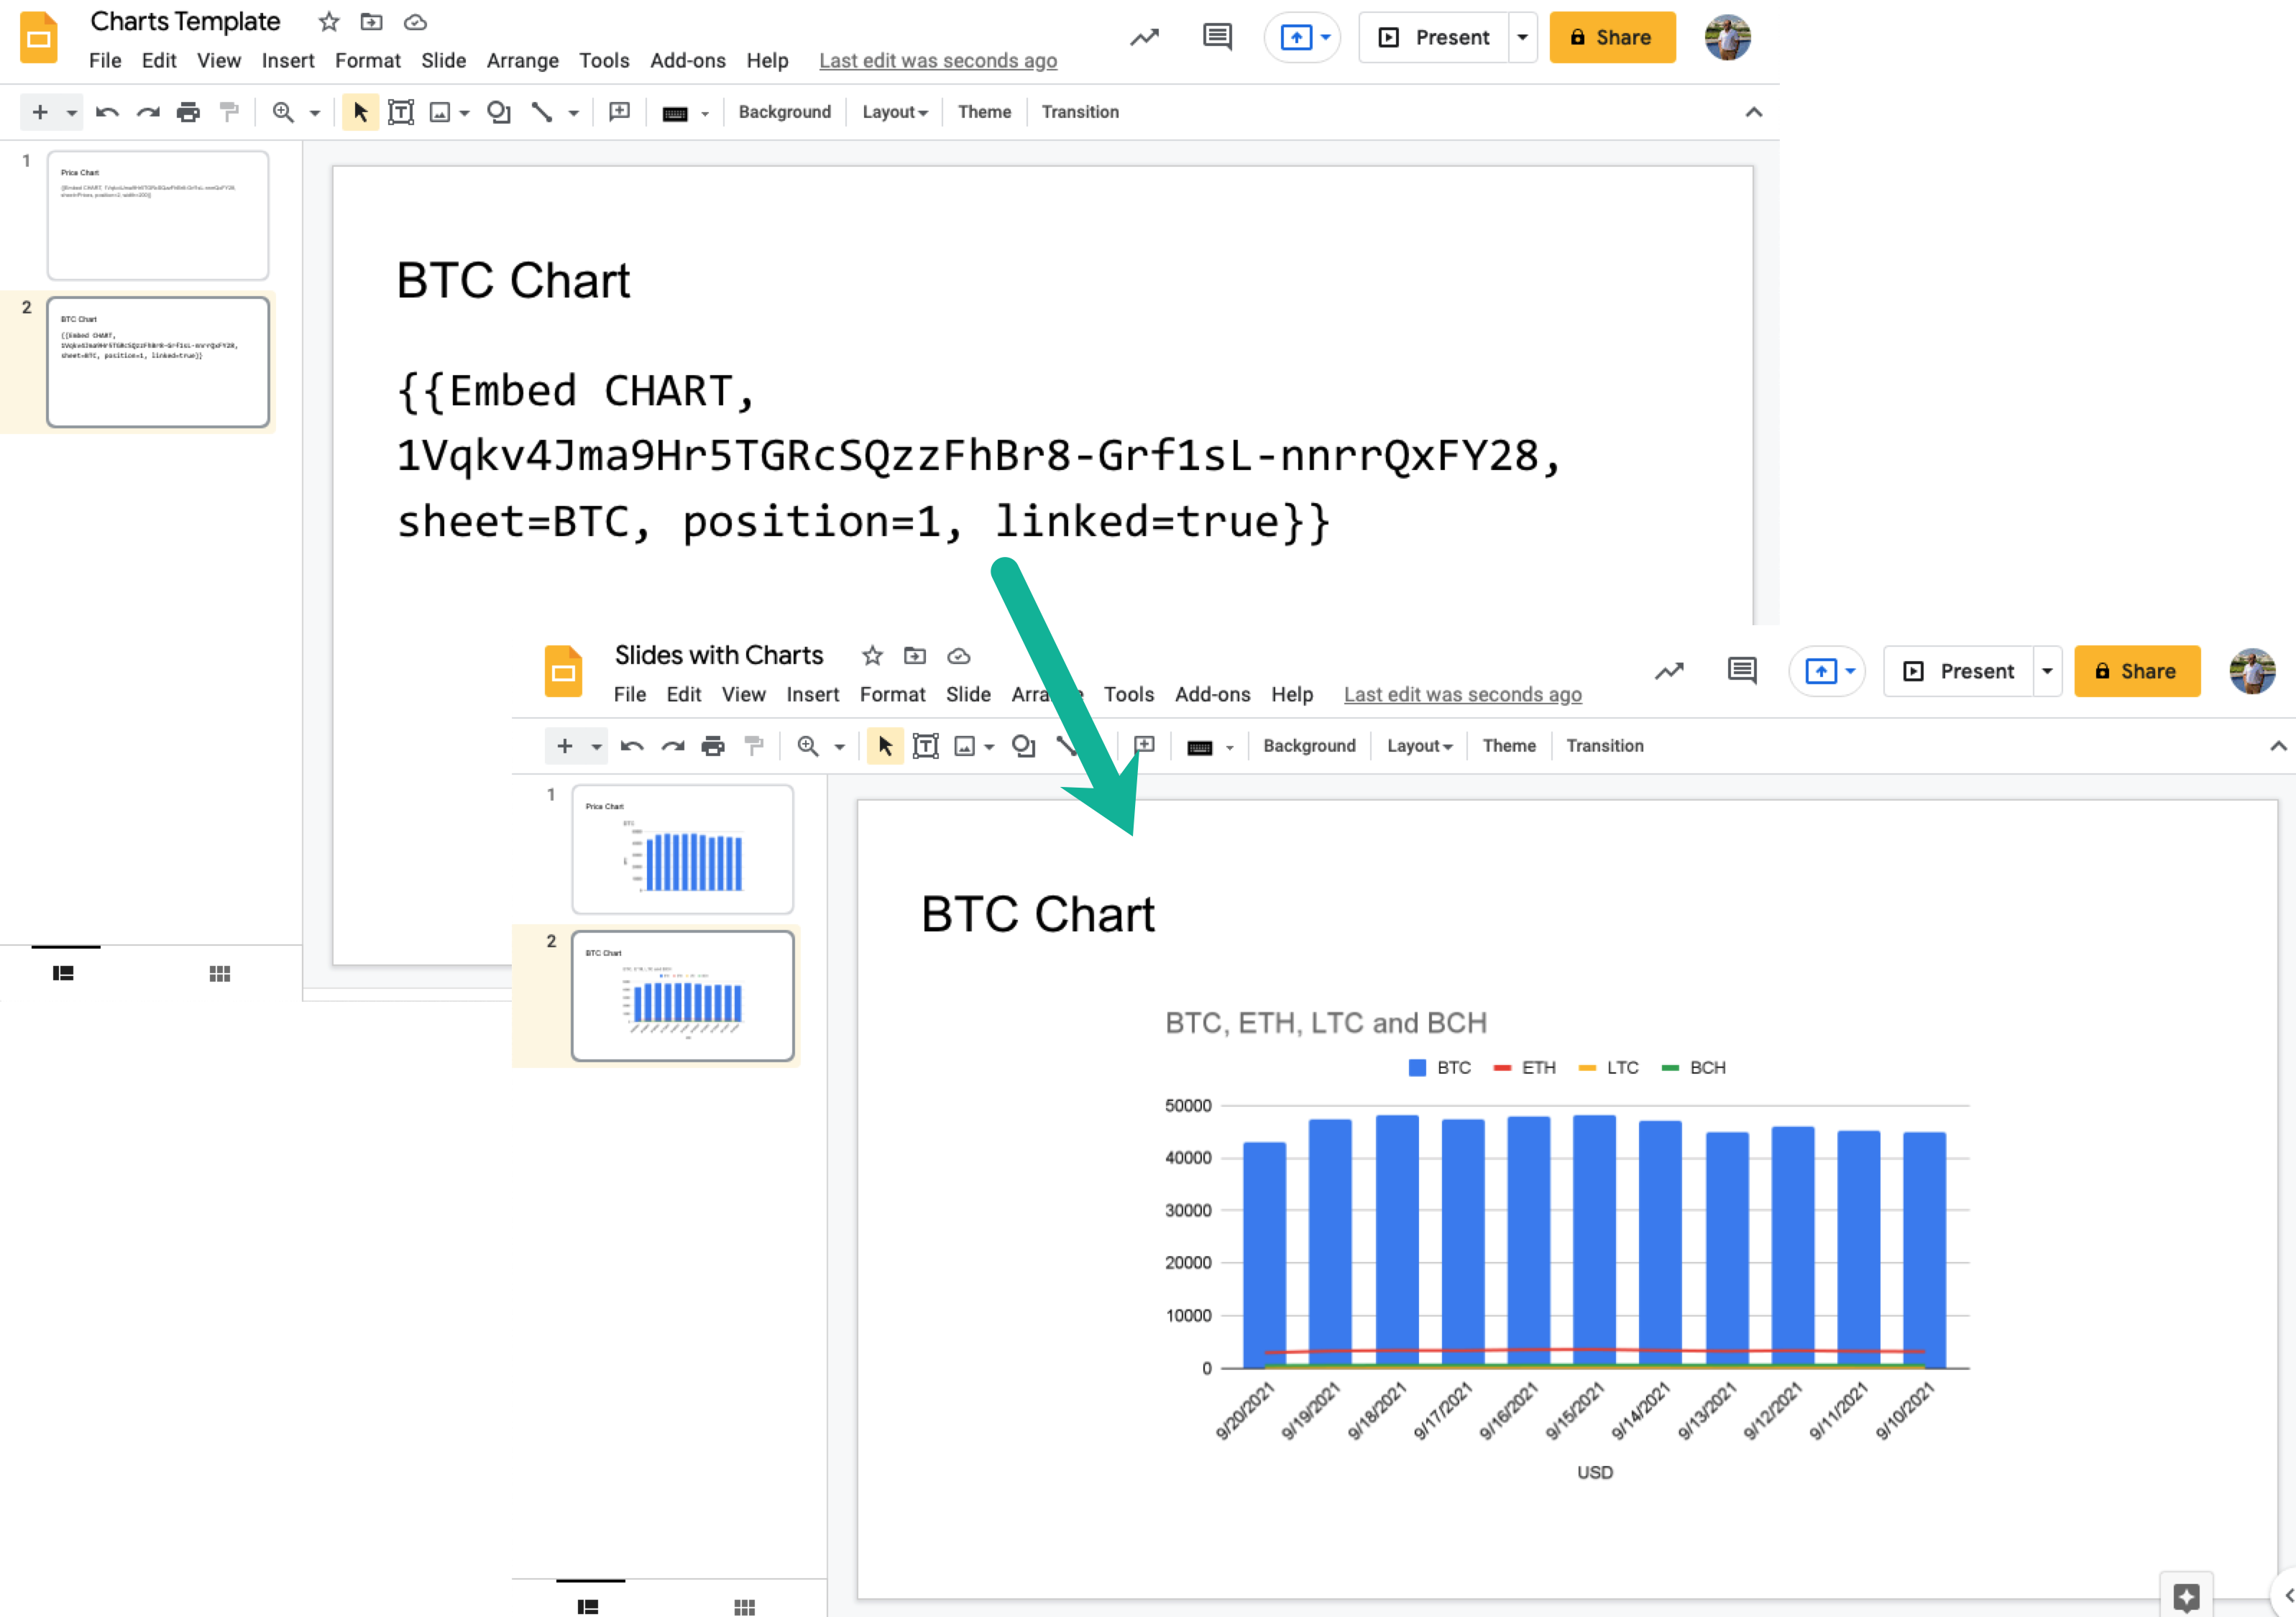
Linked Charts in Google Slides
If you are embedding a chart in a Google Slides presentation, you can use the linked parameter to link the chart to the spreadsheet. For that to happen, you need to add the linked attribute to the Embed tag:
- linked - If true, the chart image will be linked to the spreadsheet. If false, the chart image will be embedded in the document.
The updated formula will look like this:
{{ Embed CHART, 1Vqkv4Jma9Hr5TGRcSQzzFhBr8-Grf1sL-nnrrQxFY28, sheet=Prices, position=3, linked=true }}
Charts and Graphs created in Google Spreadsheets can be embedded inside emails, Google Documents, sheets and Slide presentations.